Multi-Stack Centralized Observability
This guide explains how to set up centralized observability across multiple stacks using Stacktic's component linking system.
Overview
Stacktic enables centralized monitoring where one Master Stack collects metrics and logs from multiple Remote Stacks. This is achieved through component links that automatically configure:
- Prometheus remote write (metrics federation)
- Grafana multi-stack dashboards
- Centralized alerting
Architecture
Setup Steps
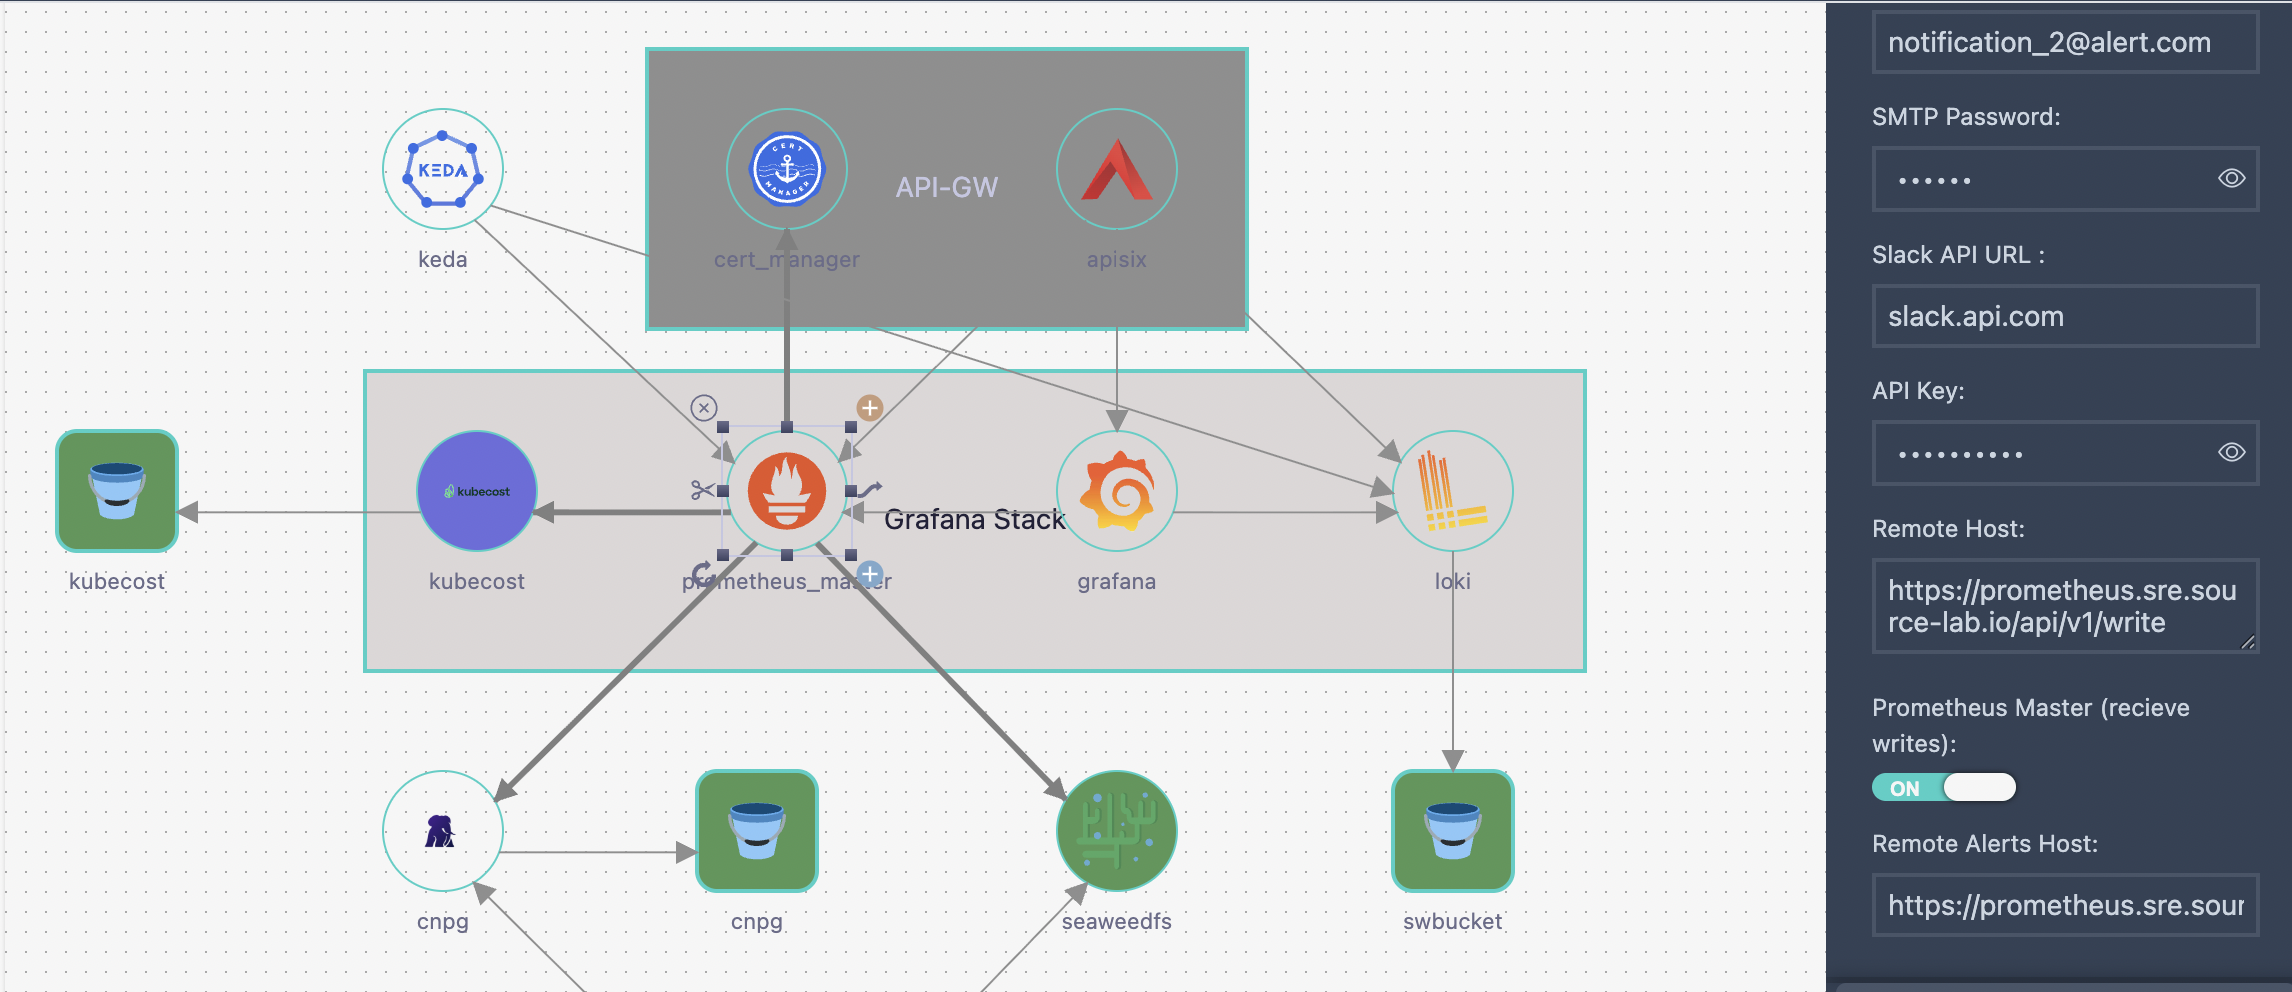
Step 1: Configure Master Prometheus
In your Master Stack, add a Prometheus component with master mode enabled.
Component Attributes:
| Attribute | Value | Description |
|---|---|---|
prometheus_master | true | Enables master mode (receives remote metrics) |
system_name | e.g. sre | Unique identifier for this stack |
remote_host | e.g. https://prometheus.sre.example.com/api/v1/write | Endpoint for remote stacks to send metrics |
remote_alerts | e.g. https://prometheus.sre.example.com/alertmanager | Endpoint for remote alert forwarding |
api_key | (optional) | Authentication key for secure remote write |
What Master Mode Enables:
- Accepts incoming remote_write requests
- Stores metrics from all connected remote stacks
- Centralizes all alerting rules
- Exposes Alertmanager UI for all clusters
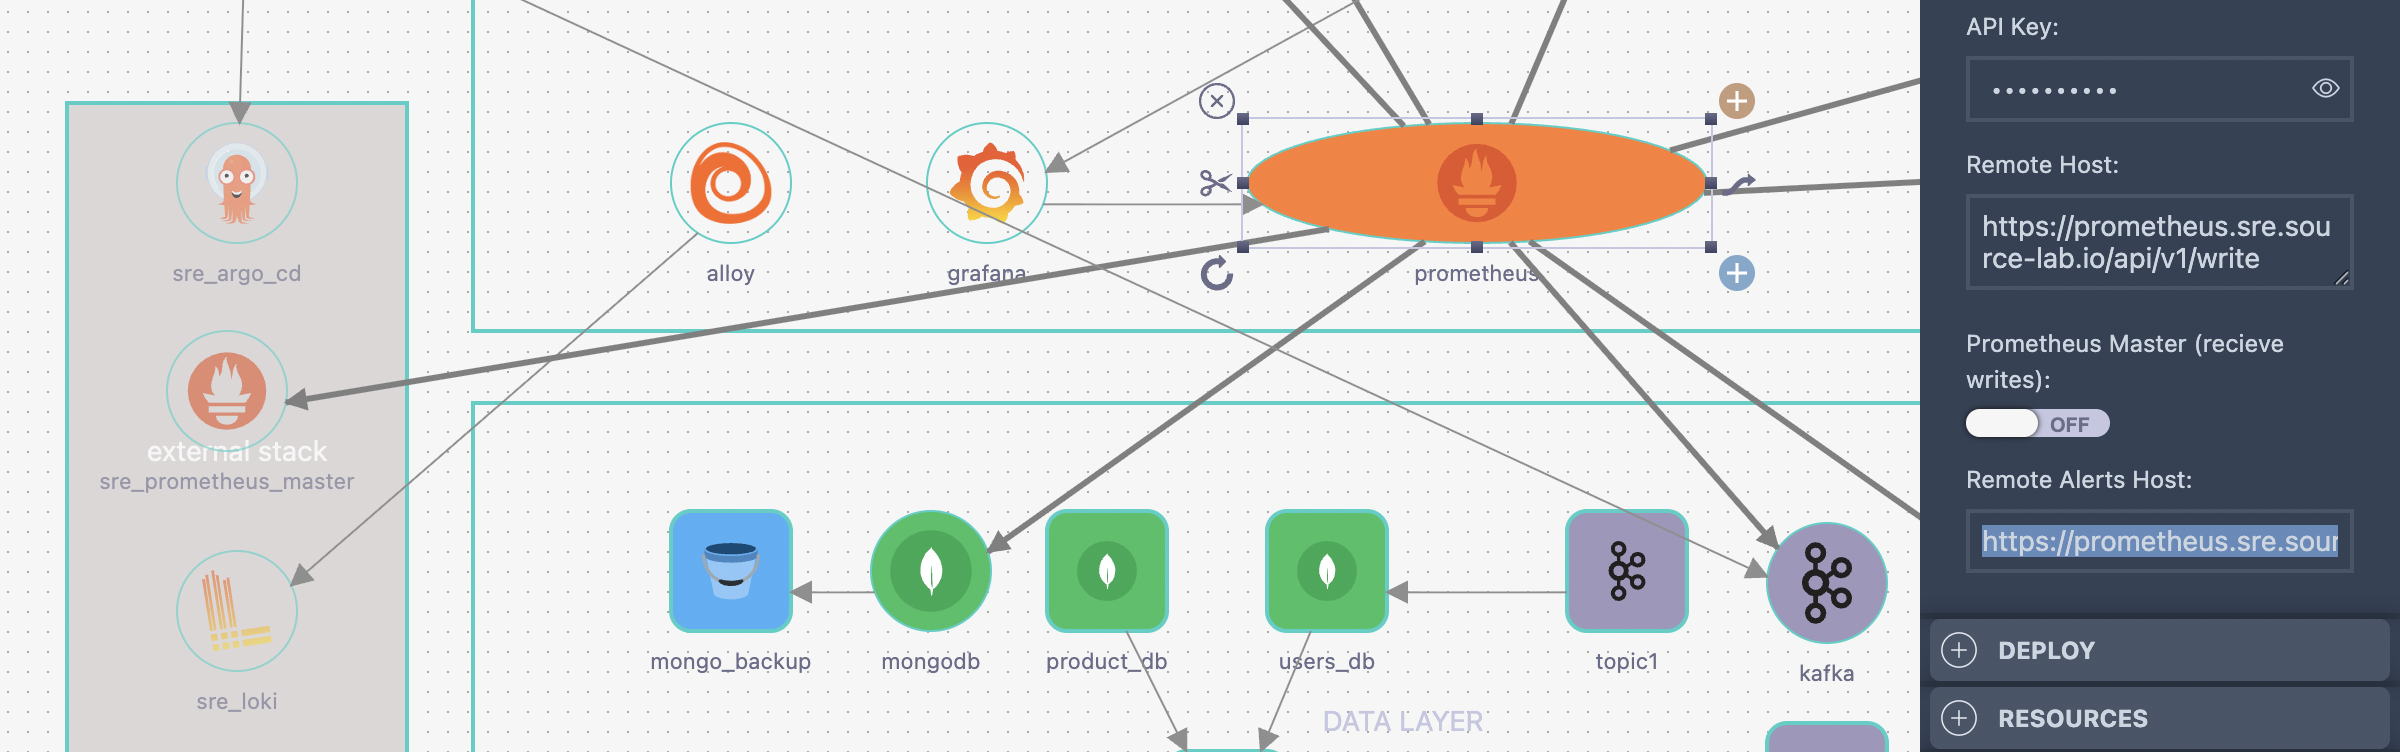
Step 2: Configure Remote Prometheus
In each Remote Stack, add a Prometheus component with remote mode.
Component Attributes:
| Attribute | Value | Description |
|---|---|---|
prometheus_master | false | Enables remote mode (sends metrics to master) |
system_name | e.g. stack-2 | Unique identifier for this stack (used as cluster label) |
Step 3: Create Link Between Remote and Master
Create a prometheus-prometheus link from the Remote Prometheus to the Master Prometheus.
Link Configuration:
| Field | Description |
|---|---|
| Source Component | Remote Prometheus (e.g. stack-2-prometheus) |
| Target Component | Master Prometheus (e.g. prometheus-master) |
| Link Type | prometheus-prometheus |
Link Attributes:
| Attribute | Value | Description |
|---|---|---|
api_key | (optional) | API key matching the master's api_key |
What This Link Enables:
- Remote Prometheus automatically sends metrics to Master via remote_write
- All metrics receive
cluster="<system_name>"label - Alerts are forwarded to Master's Alertmanager
- Grafana auto-discovers the remote stack
Step 4: Configure Grafana (Auto-Discovery)
Grafana connected to the Master Prometheus automatically discovers all linked remote stacks.
Required Link:
- grafana-prometheus link from Grafana to Master Prometheus
Automatic Configuration:
- Creates dashboard folder per stack (e.g.
sre,stack-2,stack-3) - Filters dashboards by what each stack monitors
- Injects
clusterlabel into queries for remote stacks - All queries use single Master Prometheus datasource
Attribute Reference
Prometheus Component Attributes
| Attribute | Type | Required | Description |
|---|---|---|---|
prometheus_master | boolean | Yes | true = master, false = remote |
system_name | string | Yes | Unique stack identifier |
namespace | string | Yes | Kubernetes namespace |
remote_host | string | Master only | URL for remote write endpoint |
remote_alerts | string | Master only | URL for Alertmanager |
api_key | string | Optional | Authentication key |
prometheus-prometheus Link Attributes
| Attribute | Type | Required | Description |
|---|---|---|---|
api_key | string | Optional | Must match master's api_key |
Example Configuration
Master Stack (sre)
Prometheus Component:
Name: prometheus-master
Type: prometheus

Attributes:
  prometheus_master: true
  system_name: sre
  namespace: prometheus
  remote_host: https://prometheus.sre.example.com/api/v1/write
  remote_alerts: https://prometheus.sre.example.com/alertmanager
  api_key: my-secret-key
Remote Stack (stack-2)
Prometheus Component:
Name: stack-2-prometheus
Type: prometheus

Attributes:
  prometheus_master: false
  system_name: stack-2
  namespace: prometheus
Link to Master:
Link Type: prometheus-prometheus
From: stack-2-prometheus
To: prometheus-master

Link Attributes:
  api_key: my-secret-key
How Metrics Flow
-
Remote Stack scrapes local metrics
- Adds
cluster="stack-2"label via scrapeClasses
- Adds
-
Remote Prometheus sends to Master
- Uses remote_write to Master's endpoint
- Includes api_key header if configured
-
Master stores all metrics
- Local metrics: no cluster label
- Remote metrics:
cluster="stack-2",cluster="stack-3", etc.
-
Grafana queries Master
- Master stack dashboards: no cluster filter
- Remote stack dashboards:
cluster="$cluster"filter
Verification
Check Remote Write Status
On the Master Prometheus, verify metrics are arriving:
Query: up{cluster="stack-2"}
Should return metrics from the remote stack.
Check Dashboard Folders
In Grafana, verify folders exist:
sre(master stack dashboards)stack-2(remote stack dashboards)
Check Alerts
Access Alertmanager UI on Master:
https://alertmanager.<domain>/
Filter by cluster:
cluster="stack-2"