📡 Stack LiveView
📋 Table of Contents
Overview
Stack LiveView is a unique, first-of-its-kind observability solution that provides deep insight into stack layer relationships—from database health to routes and API performance.
LiveView vs Traditional Monitoring
| Aspect | Traditional Monitoring | Stack LiveView |
|---|---|---|
| Approach | Static metrics (RPS, CPU, logs) | Metadata-driven, relationship-aware |
| Context | Isolated metrics per service | Full stack layer understanding |
| Insights | What is happening | What is happening AND why |
| Setup | Manual configuration per service | Automatic from stack metadata |
| Analysis | Surface-level symptoms | Root cause with dependencies |
Unlike traditional observability tools that rely on static metrics, LiveView is metadata-driven. It leverages Stacktic metadata and the real state of your stack to deliver a richer understanding of how your components interact.
🛠 How It Works
Simple Three-Step Setup
Step 1: Add the Agent
Simply deploy the LiveView agent into your stack
- Lightweight footprint
- Non-invasive deployment
- Works with existing monitoring
Step 2: Connect to API Gateway
Link the agent to your API gateway
- Automatic discovery of routes
- No manual configuration needed
- Instant visibility into API layer
Step 3: Automated Updates & Analysis
Everything happens automatically from here:
- Stack continuously updates API test results to Stacktic backend
- Works with public SaaS or private Stacktic instance
- Backend analyzes results and maps relationships
- Real-time insights across all stack layers
Architecture Flow
LiveView Agent → API Gateway → Stack Components
       ↓              ↓              ↓
    Metrics      Route Tests    Health Checks
       ↓              ↓              ↓
         Stacktic Backend Analysis
                  ↓
         Relationship-Aware Insights
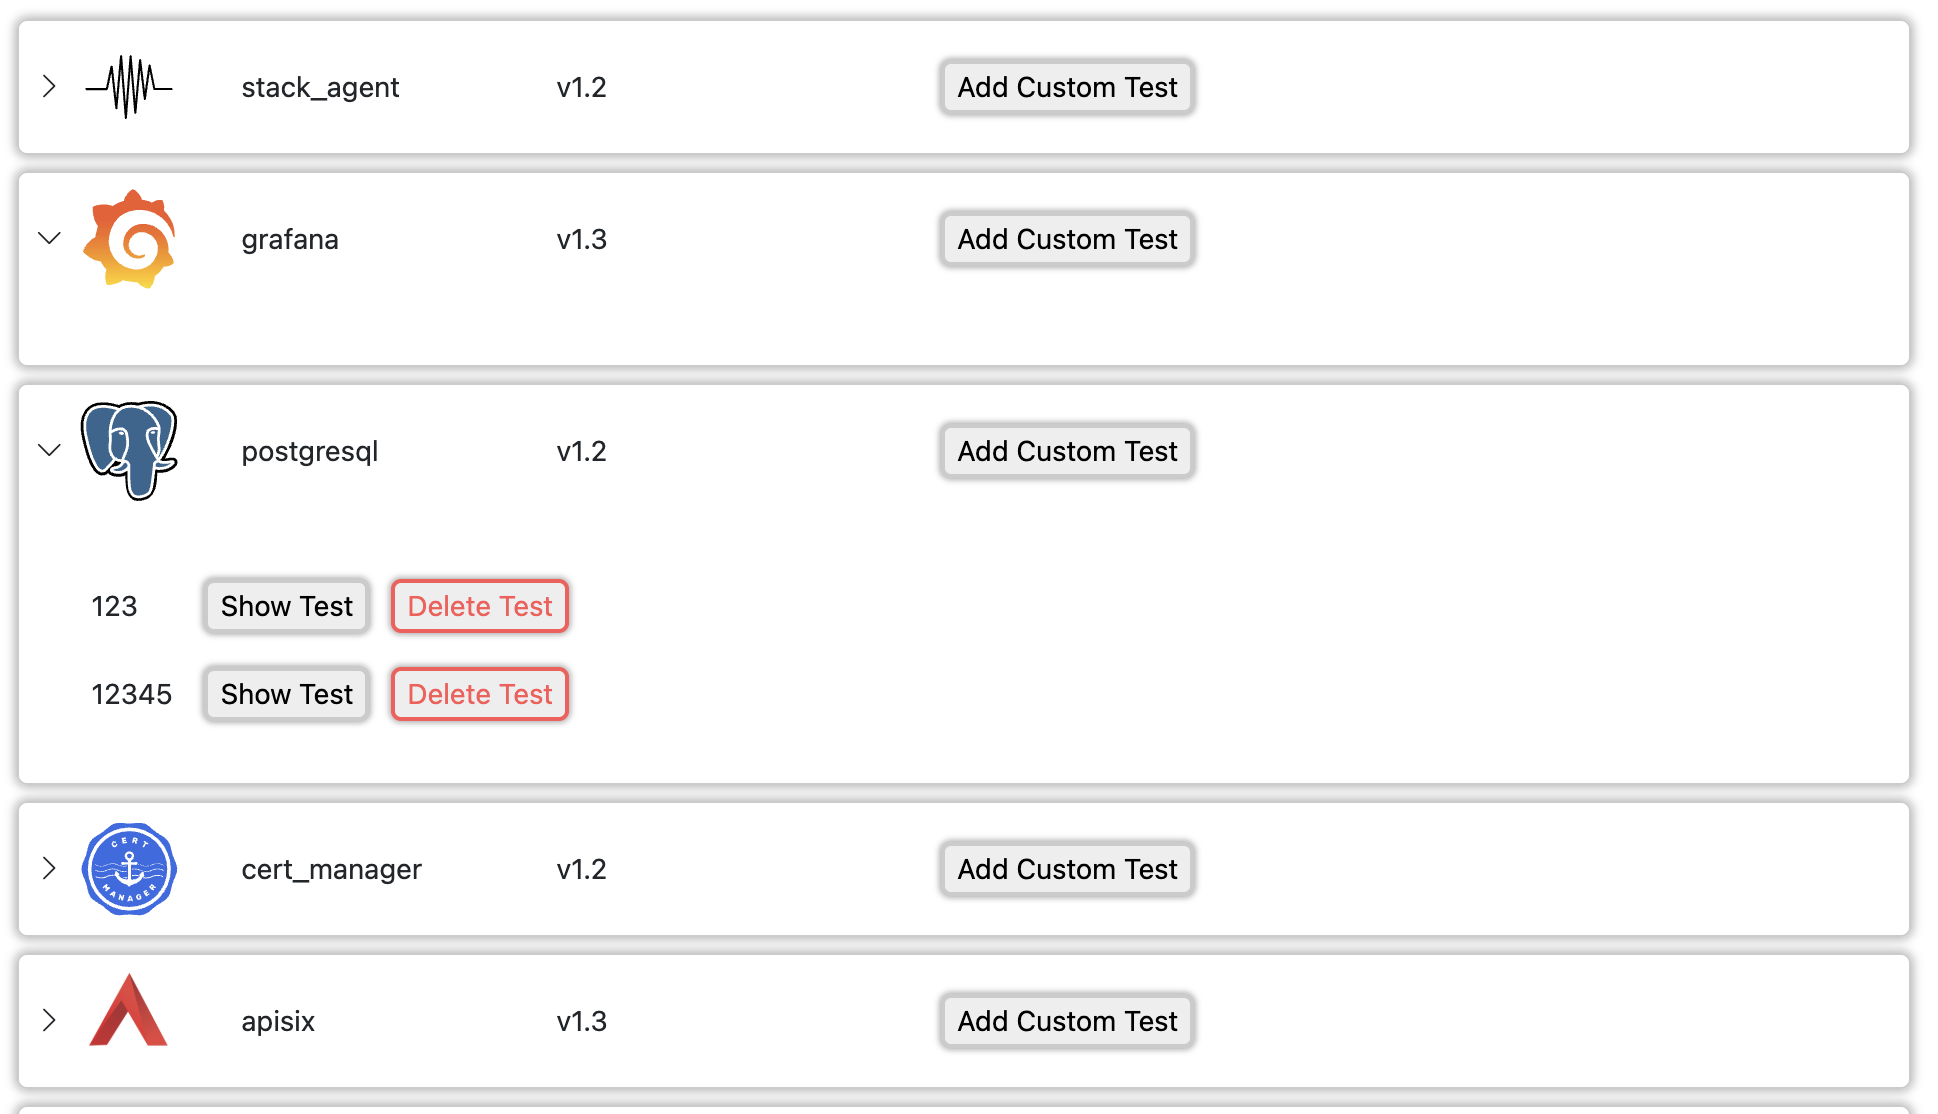
Step 3: Add your own customized tests
Create your own health, error detection and relation related to your stack (API structure guide will be generated under the stack agent documentations).
✅ Capabilities
Comprehensive Stack Monitoring
| Capability | What It Monitors | Unique Value |
|---|---|---|
| Database Health | Connectivity, performance, query patterns | Shows impact on dependent services |
| Security Checks | Compliance tests, policy validation | Automated from stack metadata |
| Auto-scaling Triggers | Resource consumption, scaling events | Predictive analysis based on relationships |
| API Performance | Route health, latency, error rates | Full request path visibility |
| Relationship Mapping | Service dependencies, data flows | Automatic from stack topology |
Beyond Traditional Metrics
LiveView provides relationship-aware insights that show:
- How failures cascade through dependent services
- Which bottlenecks affect multiple components
- Real root causes, not just symptoms
- Predictive impact analysis
📊 Example Test Results
MinIO Storage Analysis
Why is MinIO Orange?
Despite all buckets being validated successfully, LiveView identified critical issues:
- Finding: Errors detected in logs
- Root Cause: "Storage resources are insufficient"
- Impact: Potential service degradation under load
- Action: Increase storage allocation or implement cleanup policies
This demonstrates LiveView's deep analysis—going beyond simple health checks to examine logs and predict issues.
Detailed Storage Diagnostics
The detailed view shows:
- Individual bucket status
- Resource utilization patterns
- Log analysis results
- Recommended actions
RabbitMQ Test Results
RabbitMQ monitoring includes:
- Queue health and depth
- Exchange connectivity
- Consumer lag analysis
- Message flow patterns
- Performance metrics with relationship context
Key Differentiators
What Makes LiveView Unique
| Feature | Description | Business Value |
|---|---|---|
| Metadata-Driven | Uses stack topology knowledge | Automatic configuration |
| Relationship-Aware | Understands service dependencies | Better root cause analysis |
| Predictive Insights | Identifies issues before they escalate | Proactive problem solving |
| Deep Health Checks | Beyond ping/pong to actual functionality | Real availability metrics |
| Unified View | Single pane for entire stack | Reduced tool sprawl |
LiveView Intelligence Examples
Example 1: Database Connection Issue
Traditional Monitoring: "Database connection timeout"
LiveView Analysis:
  - "Database connection timeout affecting 3 backend services"
  - "API endpoints /users, /orders, /inventory will fail"
  - "Root cause: Connection pool exhausted"
  - "Recommendation: Increase pool size or optimize queries"
Example 2: Storage Warning
Traditional Monitoring: "Disk usage at 80%"
LiveView Analysis:
  - "Storage insufficient for MinIO buckets"
  - "Upload APIs will fail in ~2 hours at current rate"
  - "Affecting: Image processing, backup operations"
  - "Recommendation: Enable lifecycle policies or expand storage"
Integration Benefits
| Benefit | Impact |
|---|---|
| Zero Configuration | Saves hours of setup time |
| Automatic Discovery | Finds all relationships automatically |
| Contextual Alerts | Reduces alert fatigue |
| Root Cause Analysis | Faster problem resolution |
| Predictive Warnings | Prevents outages |
🎯 Summary
LiveView Delivers
✅ Deep Observability - Beyond metrics to relationships
✅ Automatic Setup - No manual configuration needed
✅ Intelligent Analysis - Understands your stack topology
✅ Predictive Insights - Catches issues before they escalate
✅ Unified Monitoring - Single solution for stack-wide visibility
The LiveView Advantage
LiveView transforms monitoring from reactive metric watching to proactive relationship-aware observability.
With LiveView, you don't just see what's happening—you understand why it's happening and what will happen next, enabling truly proactive operations.
Stack LiveView: See the full picture, not just the pixels.